Problem Description
The failure index and strength ratio of a honeycomb sandwich plate under the biaxial loading condition are predicted using the MSG plate model. For a plate structural analysis, the loads are usually expressed in terms of plate stress resultants {N11, N22, N12, M11, M22, M12}. In this example, N11=N22=10 N is assumed.
Software Used
Solution Procedure
Below describes the step-by-step procedure you followed to solve the problem.
1. step 1
- Open Gmsh4SC and create a new model (Change the default name). Click Material->Thermoelastic and input the matrix and fiber properties as shown in Fig. 1 and Fig. 2.
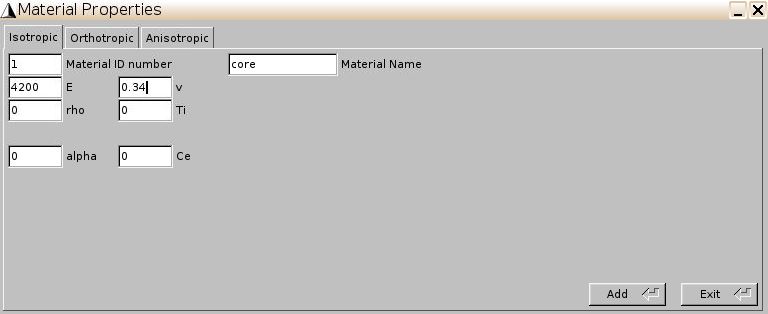
Fig. 1
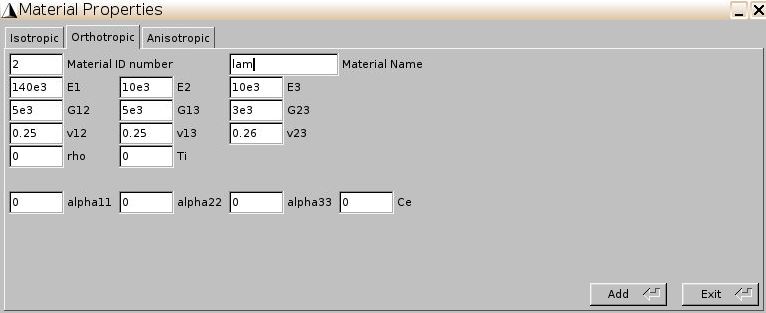
Fig. 2
* Click Geometry->Common SG-> 3D SG->Honeycomb. Select the materials for core and skim as shown in Fig. 3.
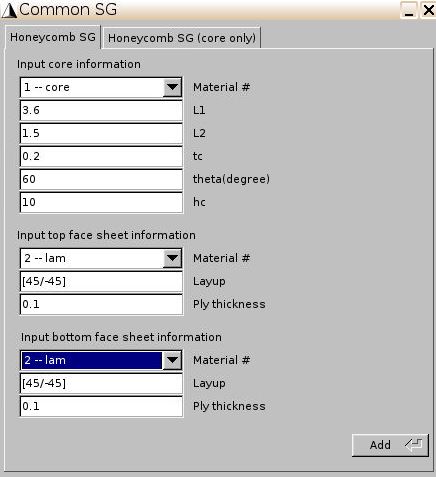
Fig. 3
* Click Mesh->Generate 3D mesh->Generate (Fig. 4.).
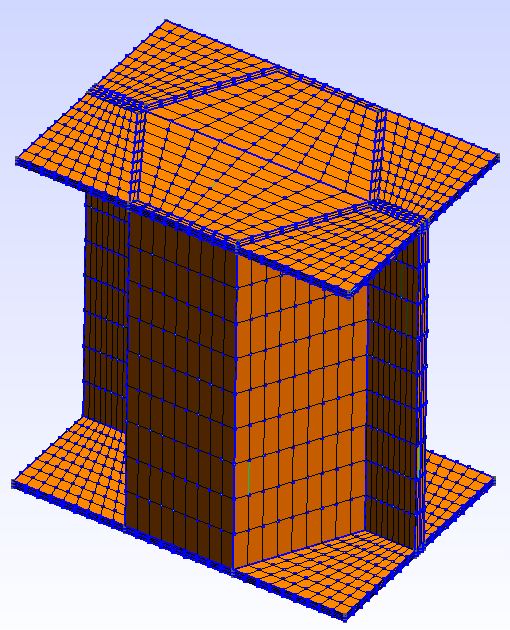
Fig. 4
* Click SwiftComp->Homogenization->Plate model. Keep the default parameters and click save and run. The homogenization results will automatically pop up (Fig. 5.).
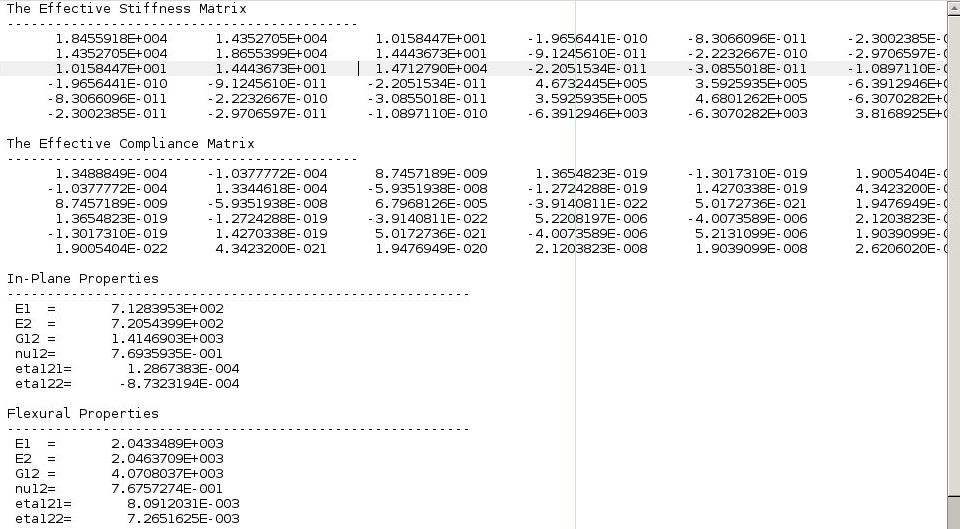
Fig. 5
2. step 2
* Click SwiftComp->Static failure->Input failure constants. Assign failure criterion (max-stress) to the core first (Fig. 6.) and input the failure constants (Fig. 7.). Repeat this step to define the fiber failure constants as shown in Fig. 8 and 9. Note that the lam is non-isotropic material and we will use Tsai-Wu failure criterion in this example.
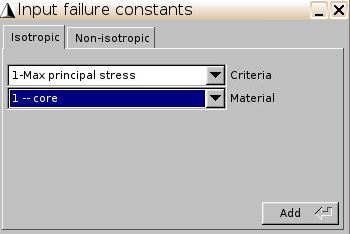
Fig. 6
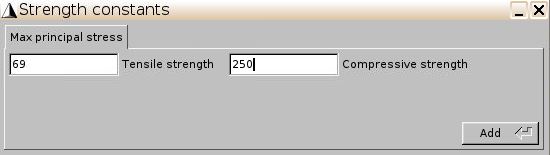
Fig. 7
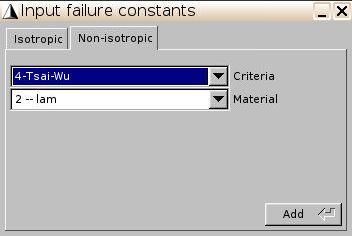
Fig. 8
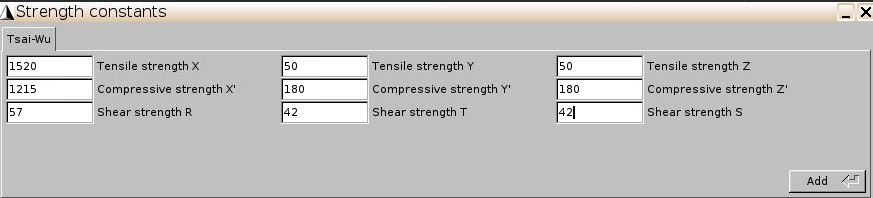
Fig. 9
* Click Failure index and strength ratio and select stress-based failure criterion. Click add. Select plate model and input and loads as shown in Fig. 10.
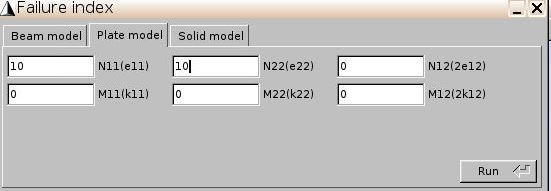
Fig. 10
* Click Run. The contour plots of the failure index and strength ratio under this loading condition is given as shown in Fig. 11 and 12.
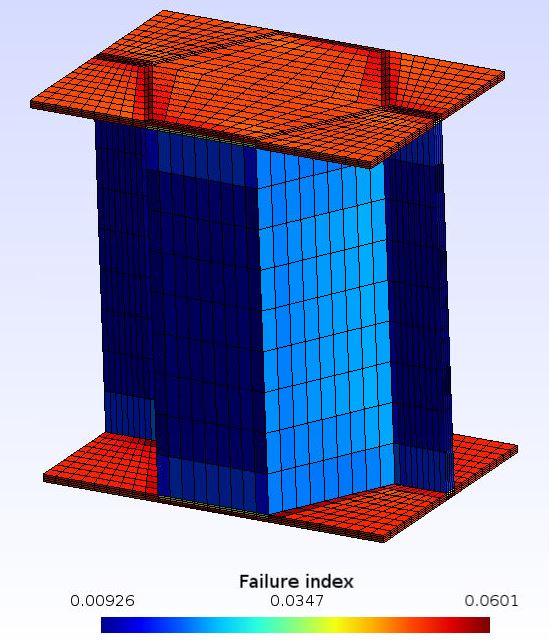
Fig. 11
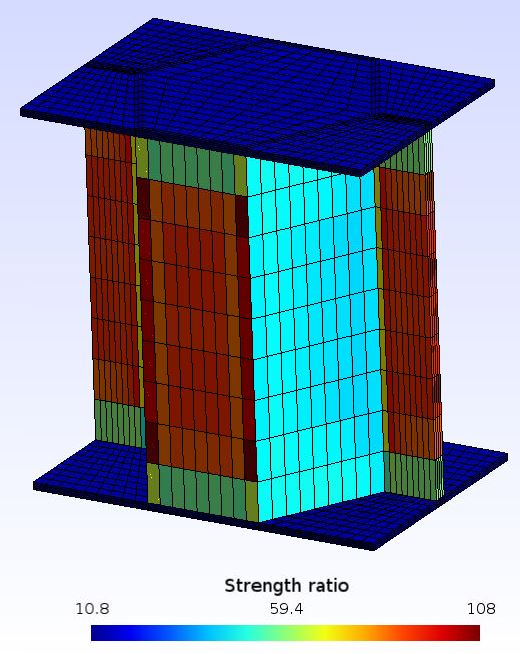
Fig. 12